
Howdy, Poptropicanos! LJ here, presenting the results and analysis from the 2025 PHB Readers’ Survey.
We garnered a total of 47 responses this year, an unfortunate decline from our last time four years ago. Despite this, our community spirit is still very much present and thriving. Now let’s begin!
Which of our past surveys did you participate in?
To start, we’re always keen to know the number of long-term participants versus those who have joined in more recently. This year marks the first instance where none of the individuals who were with us in 2014 took part in this year’s survey. (Rip!) After that, a handful of folks joined in on taking the surveys in 2016, 2017, and 2018, and even more hopped on aboard with the next three. Still, for the majority of survey participants (over two-thirds!), it’s their first time.

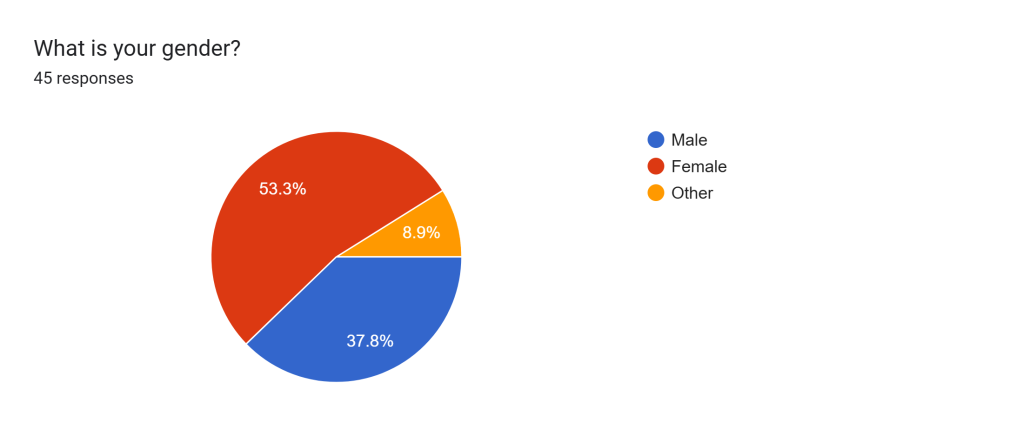
What is your gender?
Like before, a majority of the blog’s visitors are female. Over the years, the proportion of viewers identifying as non-binary or outside the traditional male-female spectrum has risen by an average of 1% annually. Additionally, since 2019, there has been a steady increase in the number of male readers.
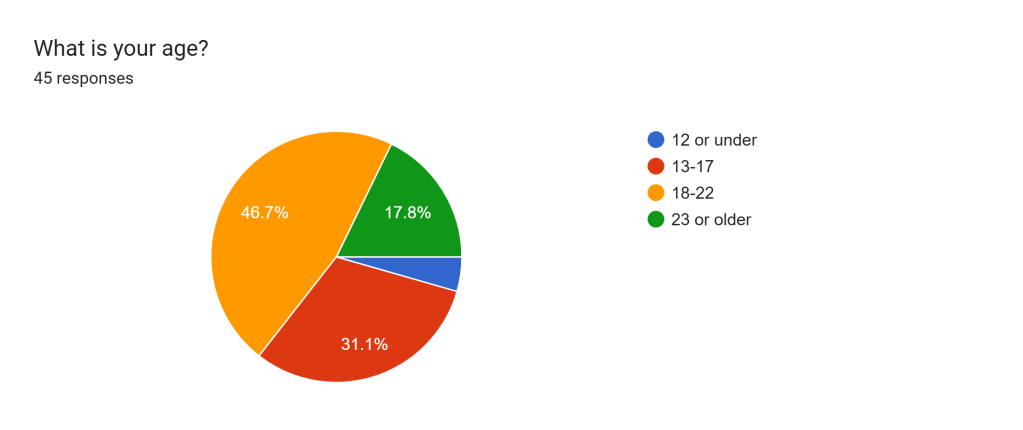
What is your age?
We were curious about your age next. As the game’s popularity fades into the past, it’s understandable that the fanbase has grown older in recent years. The latest survey reveals a marked decrease in readers aged 12 and under compared to four years ago. However, we’ve seen a growth in the number of readers in their twenties.
What country do you live in?
Our blog’s readership continues to come predominantly from the USA, capturing an incredible 81% of the survey takers, surpassing the majority from previous years. Two responded from Australia and India, while there was one each from Canada, Great Britain, and Brazil. While it’s wonderful to see our content reaching a global audience, it is a bit disheartening to see a reduction in the variety of countries we’re reaching compared to previous years.

If you live in the US, which state or territory?
This marks the first occasion that California didn’t claim the highest viewership ranking since we began conducting these surveys. New Jersey has taken the lead, which is interesting considering it hasn’t been in the top five in our past surveys!

When did you discover Poptropica?
It appears that most players first encountered Poptropica during its earlier years, yet 2020 stands out as a notable year for new players as well. Even more interestingly, some individuals only just found the game as recently as last year. I’m shocked, to be honest!

How often do you play Poptropica?
Next, we wanted to find out how regularly you play Poptropica. The results showed that around 45% of respondents fall into the least frequent categories, which isn’t too surprising under the circumstances. It’s great to see that some players (11.1%) still log in on a daily basis though!

When did you first find the PHB?
The largest portion of our current audience found the blog in the past year, with 2022 following closely behind. Welcome, y’all!  It’s interesting to note that the years from 2020 onward were the most common responses to this question. On the flip side, we’re thrilled to have some readers who have been with us since the very beginning. We appreciate your loyalty.

How did you find the PHB?
The majority of readers discovered the PHB through searching the web, which has always been the top answer for every survey. Some additional readers discovered our blog via another website. If you picked this answer, I’m interested to know where you came from, so feel free to comment below!

Where do you play Poptropica in 2025?
This was a “check all that apply” question, and most players are accessing Poptropica via Cool Math Games (62.2%) and Flashpoint (57.8%). Though Flashpoint is just a little lower in percentage, it’s impressive to reach that high considering it’s an unofficial method not endorsed by Poptropica. A small fraction (15.6%) of survey respondents no longer plays Poptropica at all in 2025.

How often do you visit the PHB?
It’s exciting to see that the most popular responses regarding how frequently readers visit the PHB are a few times a week (22.7%) and once a week (18.2%)! We’re grateful that our content is reaching and satisfying so many. 

Which types of PHB posts do you enjoy?
We then inquired about the kinds of posts you enjoy seeing from us. (Please note that in the following chart, the percentages total over 100% because respondents were allowed to choose multiple answers.)
It’s great to see that rankings, reviews, games, and Pop Fan Artist Spotlights are generating a lot of interest, as those are the kinds of posts I often contribute to the blog.  Also, many of our readers have always enjoyed stories, so fanfictions and My Place in Poptropica stories continue to be quite popular. If you’re looking for a fantastic fanfiction read, I highly recommend Smart Bubbles’ The Villain Saga, which is just kicking off its second season.
Sadly, given the state of Poptropica, I don’t anticipate breaking news becoming a frequent category on the PHB from this point forward, but you never know what might happen!

Besides the PHB, what portions of the Poptropica Help Network (PHN) do you regularly browse?
(Like the last question, the chart’s percentages total over 100% because respondents were able to choose multiple answers.)
The Poptropica Help Chat (PHC) has experienced the biggest percentage increase from before. Love to see it! There may be something special happening there soon.  However, the Poptropica Wiki still remains the top choice, while @Poptropica_Help on Twitter/X has seen a big decline in viewership. I have the feeling a large portion of our community is not actively using that platform at all anymore.
Also, this is the first time we have included our @PoptropicaHare Instagram account in the survey. Thanks to those of you who are following us there!

And that brings us to the end of the 2025 survey analysis. Thank you everybody for your participation! All of your feedback is greatly appreciated and will be taken into account as we continue to make more content for you all. 
What do you think about the results? Leave your thoughts in the comments below! I might consider conducting another survey next year as well. Pop on y’all!
